Imagine a vast, bustling library filled with millions of books — history, science, fiction, rare manuscripts, and archived newspapers all stacked together. Navigating this library to find one specific piece of information could take hours. Now picture smaller, specialised reading rooms created for different subjects: a dedicated room for economics, another for literature, one for science, each containing only the most relevant books. Suddenly, finding what you want becomes effortless.
A BI data mart works exactly like these specialised reading rooms. Instead of overwhelming users with the entire data warehouse, organisations create structured, subject-oriented subsets that focus on departmental or functional needs. For many professionals stepping into analytical roles, structured programs such as a business analysis course in bangalore help clarify how these data marts become the backbone of fast, targeted, and meaningful reporting.
The “Reading Room” Approach: Why Data Marts Matter
In the enormous library that is the data warehouse, every business function tries to gather insights from the same pool of data. Finance looks for revenue trends, marketing searches for campaign performance, and operations examines supply chain patterns. If all of them try to navigate everything at once, the process becomes slow and chaotic.
A data mart reorganises this experience. It curates the right datasets for the right people, ensuring clarity and eliminating noise. Finance receives only financial facts, HR gets talent-related records, and sales receives pipeline and revenue data. This subject-oriented approach reduces complexity and speeds up analytical tasks, enabling teams to focus solely on insights rather than navigation.
Designing the Blueprint: Steps to Build an Effective Data Mart
Creating a data mart is not just a technical exercise; it’s architectural craftsmanship. Much like designing a specialised reading room, the architect must choose the type of content, organise the layout, and ensure the room serves its visitors effectively.
The design journey typically begins with:
- Understanding user needs — what decisions must this department make daily or monthly?
- Identifying subject orientation — finance, HR, marketing, operations, etc.
- Defining granularity — should the mart store daily summaries, transaction-level details, or aggregate snapshots?
- Choosing appropriate dimensions and facts — selecting the key metrics and attributes that fuel reporting.
- Ensuring data quality and consistency — validating data as it moves from warehouse to mart.
Well-designed marts streamline workloads, improve query speed, and remove unnecessary load from the enterprise data warehouse.
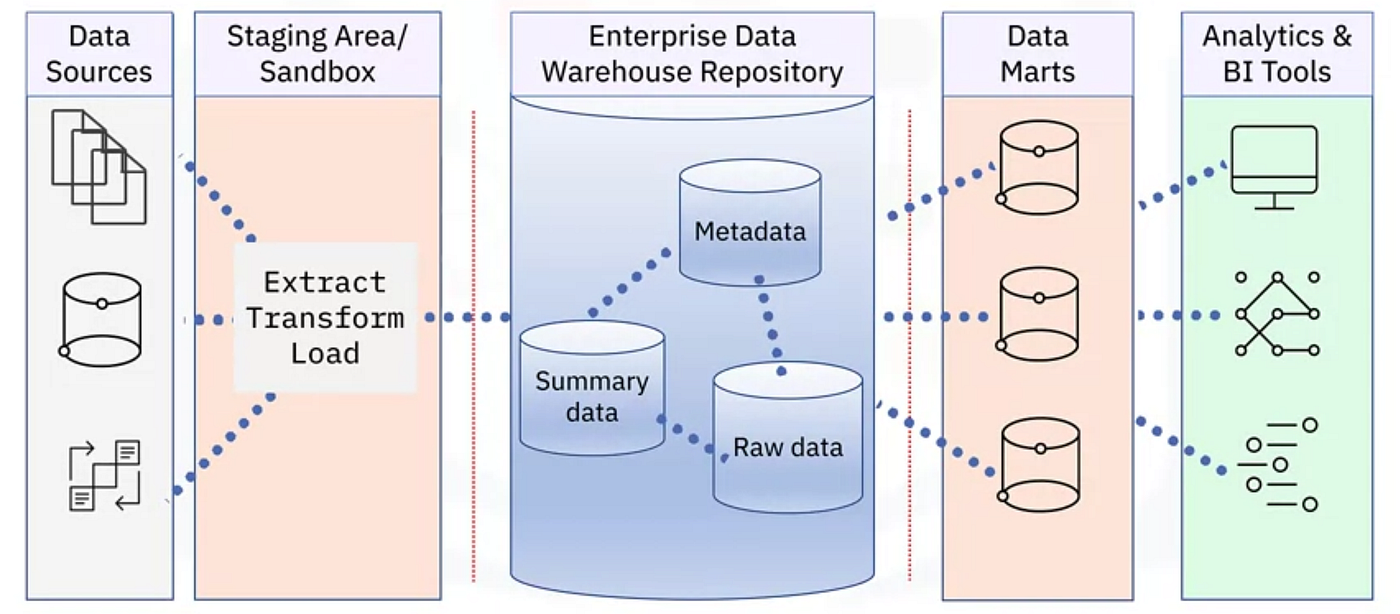
The Flow of Information: ETL and Beyond
A data mart does not function in isolation. It is continuously nourished through Extract, Transform, and Load (ETL) processes that act like a system of pipes directing clean, refined information from its source.
Extraction pulls raw data from operational systems. Transformation shapes it into structured information aligned with departmental needs. Loading places the refined data into the mart, where users can access it instantly.
This disciplined flow ensures that departmental reports reflect accurate, up-to-date insights. Teams no longer hunt through cluttered sources; instead, they access a curated view purposely designed for them. A structured learning path, such as a business analysis course in bangalore, often helps professionals understand how ETL pipelines form the backbone of mart reliability and report accuracy.
Tailoring for Impact: How Departments Use Data Marts
Each department benefits from a data mart in a way that aligns uniquely with its functions:
- Finance analyses revenue, cost, margin trends, and forecasts without sifting through irrelevant transactional data.
- Marketing examines leads, campaign ROI, funnel movement, and audience responses using data tailored to its world.
- Sales accesses deal pipelines, conversion metrics, and territory performance in real time.
- Operations monitors supply chain movement, inventory, logistics, and vendor performance using crisp, relevant metrics.
Data marts transform reporting from a slow, labour-intensive process into an intuitive, department-friendly experience. They give every team a personalised lens through which they can view the business clearly and consistently.
Maintaining Accuracy: Governance, Updates, and Evolution
Like any well-organised reading room, a data mart must be maintained continuously. Books must be updated, old copies replaced, and the catalogue refined. Similarly, data governance ensures marts remain accurate, compliant, and optimised.
Version control, audit trails, metadata management, and periodic enhancements allow marts to evolve alongside business needs. When well governed, data marts become trusted sources that leadership relies on for every critical decision.
Conclusion
BI data marts bridge the gap between the vastness of enterprise data and the precision required by individual departments. They distil complexity into clarity, transforming overwhelming repositories into focused, actionable insights.
When designed with purpose, maintained with discipline, and aligned to user needs, data marts become one of the most powerful pillars of business intelligence. They empower every department to make faster, sharper, and more confident decisions — ensuring the entire organisation moves forward with unified understanding and strategic strength.